Please wait while MATRiX is loading...
MATRiX is a shiny application for Mining and functional Analysis of TRanscriptomics data.
This project initiated by Yannick Lippi aims to facilitate access to biologist in order to publish graphs such as heatmap, PCA or Venn diagram related to specifics data produced by TRiX's facility.
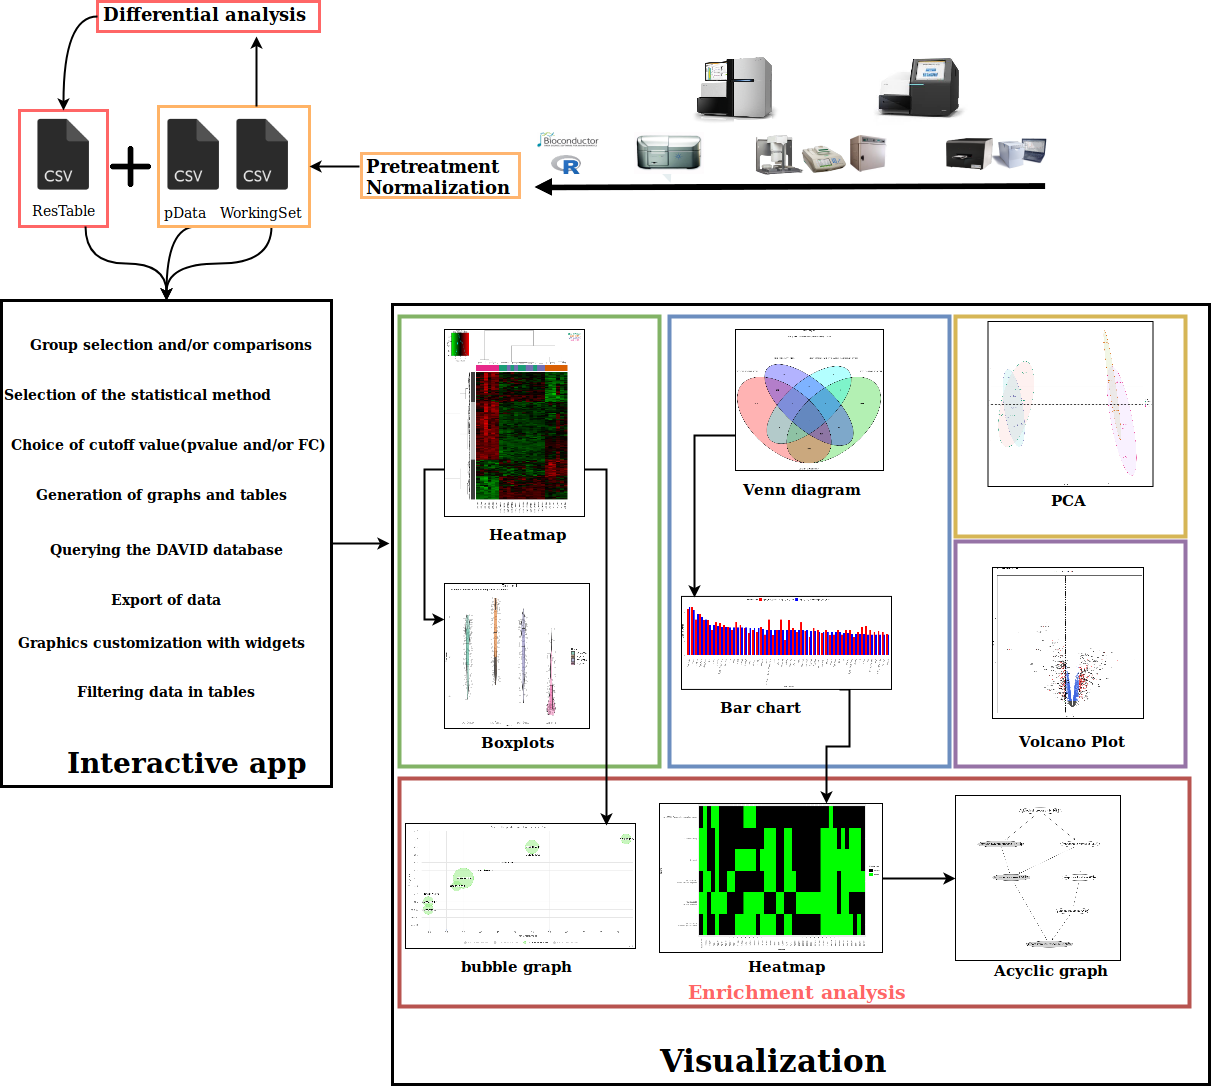
MATRiX is an application dedicated to transcriptomic analysis (DNA chip, RNA-seq, ChIP-Seq), this application incorporates quality control with Principal components analysis to summarizes Transcriptomic data and differential analysis with various methods such as Venn diagram, Heatmap clustering and GO Enrichment analysis by querying the DWS (DAVID WEB SERVICES).
MATRiX app is working with data produced by the limma, DESeq2 and edgeR packages, resulting p-values are adjusted according to the Benjamini and Hochberg procedure [Benjamini and Hochberg 1995]. PCA is computed with the FactoMineR package and the plot is produced with the factoextra package, for the Heatmap and Venn diagram the graphs are obtained respectively with the gplots and VennDiagram package, those packages are available on CRAN. This application works with specific data produced by transcriptomic facilities, you can refer to the download example file (sampleData.zip) and the MATRiX's menu (upload data).
Below is represented the global workflow passing by the statistical analysis to the visualization:
The main providers to MATRiX:
Yannick Lippi (Initiator, beta-testing, feature suggestions)
Franck Soubès (Coding, Unit testing, documentation, packaging, feature suggestions) See github
Acknowledgements
Thanks to the Toxalim's team BioToMyc & TIM and especially to the following people for their helps reporting errors, proposing new features and beta testing of MATRiX:
Laura Costes, Anne Fougerat, Claire Naylies, Philippe Pinton, Arnaud Polizzi, Marion Regnier, Sandrine Ellero-Simatos, Sarra Smati.
Special Thanks to Didier Laborie for installing the virtual machine with Ubuntu and for answering my questions
If you are using MATRiX in your work, you can cite some of the packages by clicking on the link down below.
Print version information about R, the OS and attached or loaded packages.What's new in MATRiX
In volcano plot the FC cutoff is now correctly applied. Previously the value were filtered according to log2FC.
Mar 12th 2019 - Front-end
Add data summary page, hides menu pages and redirect users after data loading.
Feb 14th 2019 - Functional results
It is now possible to sort the categorie terms based on both pvalue and Fold enrichment.
Feb 14th 2019 - Jvenn results
Duplicated genes are now highlited as orange in the output table
Feb 14th 2019 - Upload
Users can now import csv data with semicolon or comma separatos by precising the decimal
Jan 25th 2019 - Bug
Correct david$getSpecieNames (Specieshm and Speciesvenn)
Jan 25th 2019 - Data
Users can now register as a team and load their data directly from the server (only for 2019 projects and logs are provided in report)
Jan 25th 2019 - MATRiX
MATRiX is now running with Shinyproxy (Spring + Docker)
Jan 21th 2019 - Increased exploration
Add features to filter the top n based on the FDR/RAW and logFC, Generate strip chart for specific genes and barplot for Volcano plot
Jan 11th 2019 - Data
MATRiX is now compatible with Microarray, ChIP-seq and RNA-seq data
Nov 30th 2018 - MATRiX
Add tootlip for distance, its now possible to export acyclic graphs in pdf and eps, correct bugs for classification enrichment with 0 nodes by inactivating donwload button
Nov 29th 2018 - Venn Diagram/HTML
Correct bugs now venn diagram table is based on genes and not probes.
Nov 5th 2018 - Venn Diagram
Remove non annotated genes.
Oct 19th 2018 - Volcano plot
Search group of genes based on regular expression.
Oct 15th 2018 - Venn Diagram
Change the library to Jvenn.
Aug 15th 2018 - Presentation/Video
Added a video to present MATRiX and add modules to import files.
Aug 10th 2018 - Upload/Volcano
You can explore your different comparisons with a volcano plot.
Aug 6th 2018 - Venn Diagram/Enrichment
Add acyclic graph if download.
Aug 4th 2018 - Heatmap/Bubble graph
You can display or not the labels within the bubbles.
Aug 3th 2018 - Heatmap/Go(Analysis)
You can now plot a bubble graph (Highcharts) that summarizes the top categories from the resulting datatable.
Jul 28th 2018 - Home/Support
You can asks your questions directly in the Support.
Jul 25th 2018 - Tutorial/Video
Soon will be added a video to summarise the application.
Jul 20th 2018 - New page
Add a Home page regrouping informatios about the app.
Jul 16th 2018 - Venn
You can now choose your color for the venn diagram.
Jul 16th 2018 - Bug fixes
Venn diagram display erros when filtering.
Jul 5th 2018 - Venn/DAVID
Add Gene functionnal classification for selected intersection(s).
Jun 26th 2018 - Add features
It's now possible to interact with the rendering table to filter the table in the aim of plotting the top n genes. For the GO enrichment it is now possible to select the rows in order to display the gene symbol according to the entrez ids.
Jun 22th 2018 - Bug fixes
For two contrasts the venn.draw function was not ordering the contrast names in the right order.
Jun 20th 2018 - MATRiX
First public release of MATRiX. Enhancement of the gui with the use of dashboard package.
Jun 18th 2018 - GO enrichment
It is now possible to query the DWS for the Heatmap and save the result in xlsx format for the different clusters
Jun 15th 2018 - DNS
Adding DNS for the MATRiX application (matrix.toulouse.inra.fr)
Jun 10th 2018 - Venn diagram
The venn diagram FC and display of the top n genes have been added to compare the results of 2 or more contrasts.
Jun 5th 2018 - PCA/Heatmap
Display color groups side by side in the gui.
May 29th 2018 - beta-test
The service will be made available once the beta test phase is officially completed.
How to import ?
- First click on the browse button to load the data
- After the pop up has appeared, you will have to select the data files.
- It is also possible to directly drag and drop your data files in the browse button
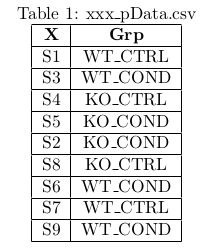
- You need three distinct csv files, these files are respectively named xxx_pData, xxx_WorkingSet and xxx_ResTable.
- pData : The experimental design in a 2 column table that associates samples to their respective biological conditions
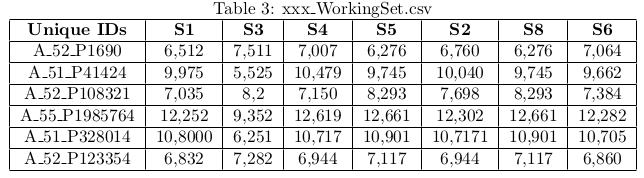
- WorkingSet : The table of the normalised expression values (log2, cpm, ...) with genes in rows and samples in columns. The first column must contain the unique gene identifier (or transcript, probe, ...).
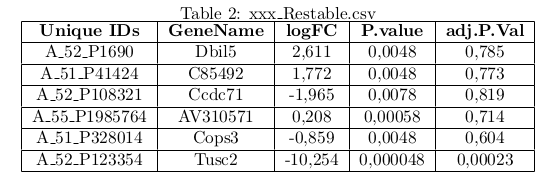
- ResTable : The table containing the results of differential analysis (fold change, p-value and FDR) next to a first column with unique gene identifier and a second column with the gene symbol.
- The final step consist to select all the data at once and then confirm the selection by clicking on the open button.
- A green message will then appear to confirm the data loading with a summary table.
Tips
- Unique IDs and GeneName columns must appear in the statistical data and unique IDs columns for Workingset in order to import the data (RNA-seq, DNA-chips, ChIP-Seq).
- You can select a region by handling the left click button if the files are stacked together, if it's not the case you can select the different files by maintening the Ctrl button and clicked on the files.
Warning
- It is highly recommanded to not modify these files (removed columns, change column names ...) in the aim of not disturbing the well functionning of the application.
Upload data
Files configurations:
Upload project .csv files from:
2. your team's project on the server location
Data summary
VOLCANO plot
Highlight gene(s): fill comma-separated GeneNames
PCA settings
Filter the datatable
Here's a tracker for your different selections:
You have chosen the following comparisons
for a total of
genes with a P-value and FC treshold respectively set to
and
There are
significant genes
for this intersection
if you click on the top DE genes button you will plot the top
rows the of the previous table
Venn settings
A comma-separated list of x11 or hex colors.
Select your Type of Venn
Display the stat
Police's size
Find an element in list(s)
Display switch
Here's a tracker of your different parameters:
Selection of
significant features
for the following comparison(s):
Based on the
method, with a P-value and FC treshold respectively set to
and
Limitation to a maximum of
top regulated features per comparison according P-value.
Clustering distance method :
. Number of Clusters selected:
Graphical color settings of the groups :
are respectively :